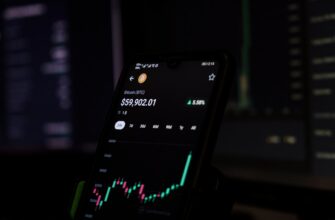
Crypto markets move at lightning speed, leaving traders scrambling to interpret price action. Amidst the chaos, one dataset stands as the backbone of informed decision-making: crypto OHLCV data. This structured financial information captures the pulse of cryptocurrency markets, enabling everything from technical analysis to algorithmic trading. Whether you’re a day trader scrutinizing minute-by-minute fluctuations or a long-term investor spotting macro trends, understanding OHLCV is non-negotiable. In this comprehensive guide, we’ll break down what makes this data format indispensable, how to leverage it, and where to access reliable sources.
## What is Crypto OHLCV Data?
OHLCV represents five critical data points captured over a specific timeframe (e.g., 1 minute, 1 hour, or 1 day). This standardized format originated in traditional markets but has become fundamental to crypto analysis. Each component tells a story:
* **Open**: The starting price when the period begins
* **High**: The peak price reached during that interval
* **Low**: The lowest price point recorded
* **Close**: The final price at period’s end
* **Volume**: Total trading volume (in units or USD) for the asset
Visualized through candlestick charts, OHLCV transforms raw numbers into actionable insights. The “body” shows open/close ranges, while “wicks” indicate highs/lows. Volume bars beneath confirm momentum strength. This compact format distills market psychology into a single visual snapshot.
## Why OHLCV Data is Crucial for Crypto Trading
In volatile cryptocurrency markets, OHLCV provides the analytical foundation for strategic decisions. Its importance stems from three key advantages:
* **Trend Identification**: Consecutive higher highs/lows signal uptrends, while lower highs/lows suggest downtrends. Close prices reveal market conviction at period endings.
* **Volatility Measurement**: The spread between high and low prices quantifies market turbulence – critical for risk management.
* **Volume Validation**: Spikes in volume confirm breakout legitimacy. Low volume during price moves suggests weak momentum.
Without OHLCV, traders would lack the context to distinguish between noise and meaningful price action. It’s the difference between gambling and evidence-based trading.
## How to Interpret Crypto OHLCV Data Like a Pro
Mastering OHLCV interpretation starts with candlestick patterns and volume analysis:
**Key Candlestick Patterns:**
* **Bullish Engulfing**: Large green candle swallows prior red candle – reversal signal
* **Bearish Harami**: Small candle within prior large candle’s range – trend exhaustion
* **Doji**: Near-equal open/close with long wicks – market indecision
**Volume Analysis Rules:**
1. Rising prices + increasing volume = Strong uptrend
2. Rising prices + declining volume = Weak trend (caution)
3. Breakouts with 2x average volume = Higher probability success
Combine OHLCV with indicators like Moving Averages (identify trends) or RSI (spot overbought/oversold conditions) for robust analysis. Always contextualize timeframes – daily charts reveal macro trends while 5-minute data suits scalping.
## Top Sources for Reliable Crypto OHLCV Data
Accessing accurate, real-time data is paramount. Key sources include:
* **Exchanges**: Binance, Coinbase, and Kraken offer API access to live OHLCV feeds. Ideal for active traders but requires technical setup.
* **Aggregators**: CoinGecko and CoinMarketCap compile multi-exchange data. Best for free historical datasets and broad market views.
* **Premium Providers**: Kaiko, CryptoDataDownload, and TradingView deliver institutional-grade data with clean formatting and historical depth (paid).
When evaluating sources, prioritize:
– Data freshness (real-time vs. delayed)
– Historical depth (years vs. months)
– Asset coverage (major coins vs. altcoins)
– Export formats (CSV, JSON, API)
## Practical Applications of OHLCV Data in Cryptocurrency
Beyond basic charting, OHLCV powers sophisticated crypto workflows:
* **Algorithmic Trading**: Bots execute trades based on OHLCV patterns (e.g., “buy when 50MA crosses 200MA on 4H chart”).
* **Backtesting Strategies**: Historical OHLCV lets traders simulate strategies against years of market data.
* **Liquidity Analysis**: Volume data reveals optimal entry/exit points by identifying support/resistance zones.
* **Market Sentiment Gauges**: Unusual volume spikes often precede major price movements.
Institutional firms increasingly combine OHLCV with on-chain metrics for holistic analysis, demonstrating its scalability from retail to professional use.
## Crypto OHLCV Data FAQ
**Q: How often should I check OHLCV data?**
A: Depends on your strategy: Day traders monitor 1-15 minute charts; swing traders review 4-hour/daily; investors focus on weekly/monthly data.
**Q: Can OHLCV predict Bitcoin’s price?**
A: While not predictive, it identifies probabilities. Historical patterns (e.g., head-and-shoulders) indicate potential outcomes when combined with volume confirmation.
**Q: Why is volume separate in OHLCV?**
A: Volume validates price movements. A price breakout with low volume is statistically more likely to fail than one with high volume.
**Q: Is free OHLCV data reliable?**
A: Exchange-provided data is accurate but fragmented. Aggregators normalize data across exchanges – sufficient for most retail traders. Professionals often pay for cleaned, enterprise-grade feeds.
Mastering crypto OHLCV data transforms market noise into actionable intelligence. By decoding the story behind each candlestick and volume bar, you’ll trade with confidence in even the most turbulent crypto markets.